
Viewing information in the monitor
As well as providing a high-level summary of all your tasks, the monitor also lets you view more detailed information about specific tasks.
To switch to monitor view:
-
Open a Compose project and click the Monitor icon in the top right of the console.
A list of tasks is displayed for the current project. The left pane of the monitor allows you to filter the task list by status as well as indicating the current number of running, failed and completed tasks.
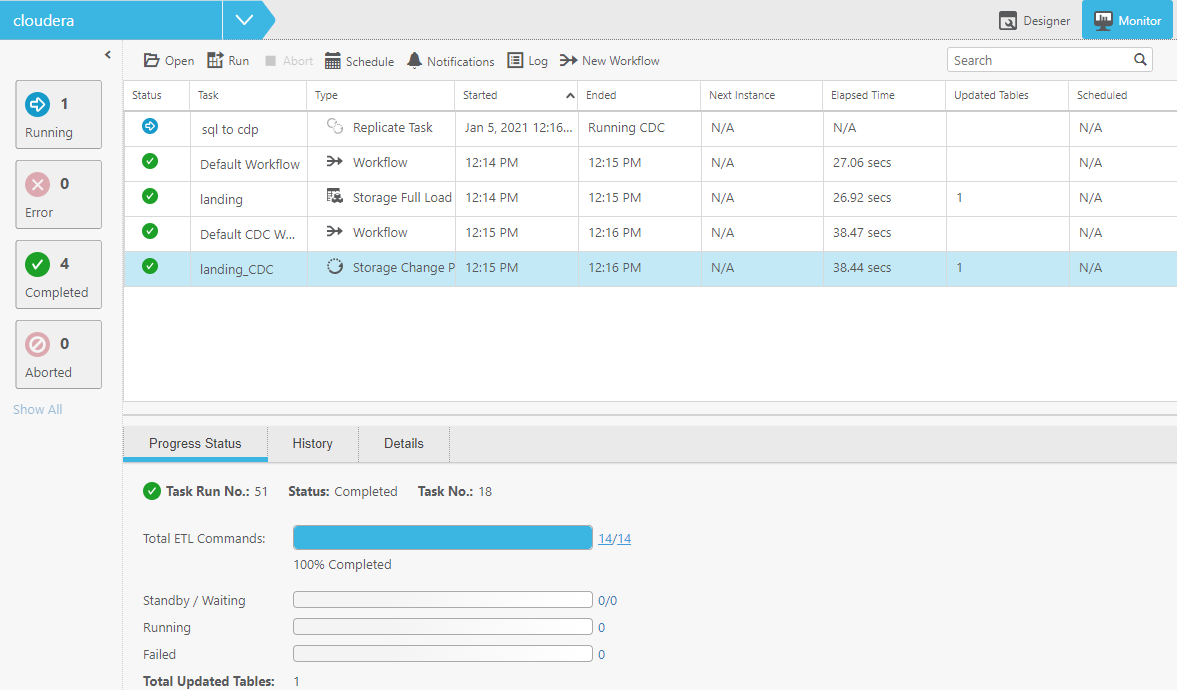
For each task, the monitor displays the following information:
- Status - Running, Completed, Failed or Aborted.
- Task - The task name.
Type - The following task types are available:
- Storage Full Load - Moves the data in its entirety from the Landing Zone to the Storage Zone.
- Storage Change Processing - Moves changes to the data from the Landing Zone to the Storage Zone.
- Workflow - Executes several tasks in succession. See also Adding and designing workflows.
- Command - For information about Command Tasks, seeCreating and managing command tasks
- Replicate - The Qlik Replicate task that moves the data from the source database to the Landing Zone.
- Started and Ended - The date and time the task started and completed (according to the server time). If the task is running, the Ended column will display the current progress. In the case of a Replicate task performing Change Processing, Running CDC will be displayed.
- Next Instance - The next time the task is due to run (if the task is scheduled).
- Elapsed Time - The time it took for the task to complete or - if the task is still running - how long the task has been running.
- Updated Tables - The number of tables updated in the Storage Zone.
- Scheduled - Whether the task has been scheduled. "N/A" indicates that the task has never been scheduled whereas a check box indicates that the task has been scheduled. Clear the check box to disable the scheduling.
-
To view additional information about a task, select the task. The information is displayed in the following tabs in the lower pane of the monitor:
-
Details - The Details tab shows the following status bars:
- Completed - Shows the tables that have already been loaded into Hive.
- Loading - Shows the tables currently being loaded into Hive.
- Queued - Shows the tables waiting to be loaded into Hive.
- Error - Shows the tables that could not be loaded into Hive due to error. Click the Show Details link below the bar to see more information about the statement(s) that resulted in the error.
To see more information about tables in a particular status, click the status bar. A list of tables in the selected status will be shown.
You can also click the Task Commands button for more information about the operations performed during the task.
-
Progress Status - The Progress Status tab shows the task’s current progress as well as the sub-status (Waiting/Standby, Running, Failed, etc.) of operations within the task. To see details about a specific operations, click the number to the right of the operation status.
For example, to view more information about an operation with an error status, click the number to the right of the Failed bar.
-
History - The History tab provides a list of previous task instances.
To view a task instance’s log file, select the task and click the View Log button.
To view more details about a task instance, either double-click the instance or select the instance and then click the View Instance Details button. The Details tab is shown.
-
- To run a task immediately, select the task and then click the Run toolbar button.
- To view and manage a task’s settings, select the task and then click the Open toolbar button. For more information about the settings, see the relevant topic in this guide.